I found this to be a great (and fun) way to create a shared understanding of the team’s current and/or desired test strategy and to surface differences in insights between team members.
Background
In Succeeding with Agile, Mike Cohn introduced the “test automation pyramid”, a visual model that shows the ideal distribution of tests for a software system. I will not go in to the details of Cohn’s test automation pyramid here, instead I’ll draw it for you:

At the base of Cohn’s test automation pyramid is a large number of solid unit tests. At the top is a small amount of (more brittle) UI tests. In the middle is a sized-in-between amount of service-level tests.
There is some overlap with Robert C. Martin’s test strategies from “The Clean Coder”, chapter 8. Martin’s representation is more detailed, including manual exploratory tests inside the pyramid, at the top. Furthermore, he splits the service level tests into component and integration tests (I will not go into details about that here):
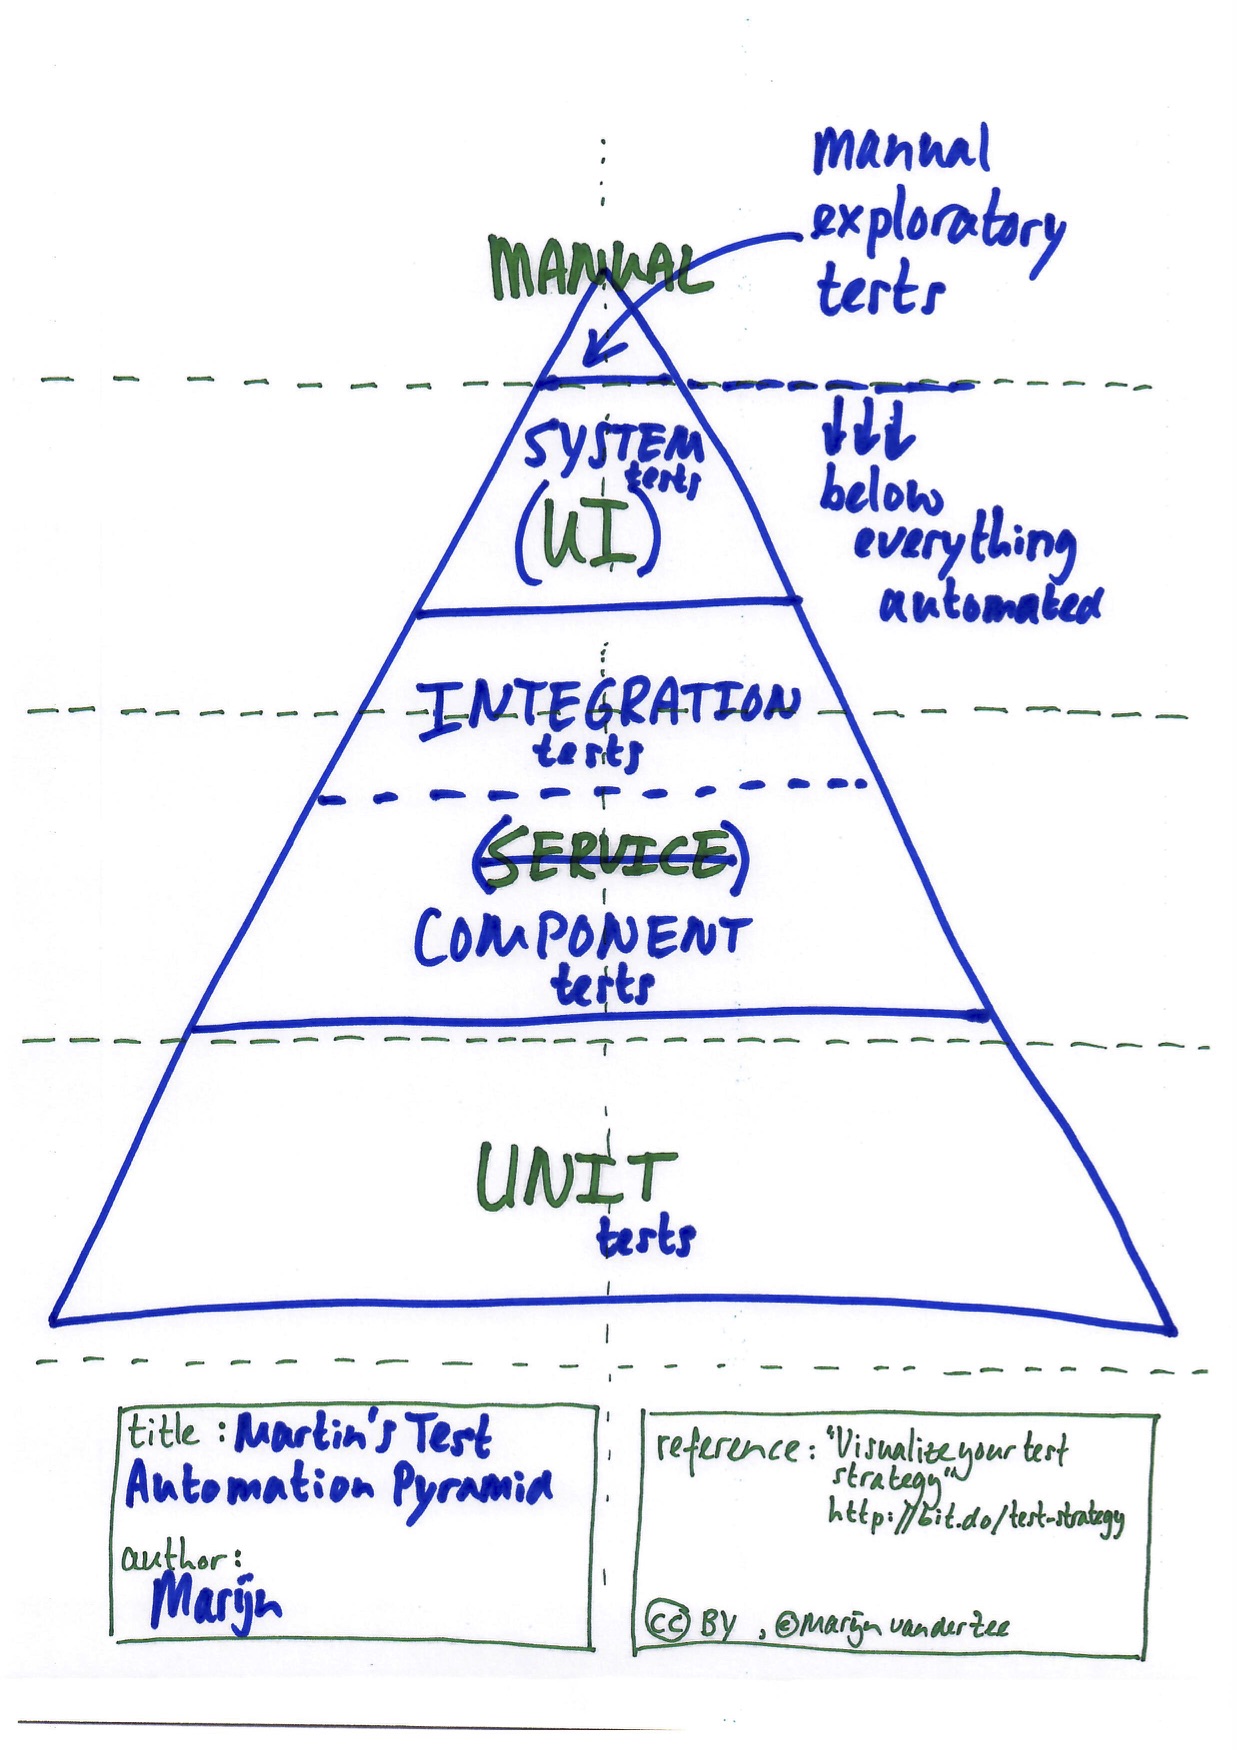
Three things I like about Martin’s pyramid is that Martin explicitly links the base of the slice to the percentage of the system covered by the tests, that he acknowledges the importance of manual exploratory test and that prescribed manual tests explicitly do not have a place in his ideal testing strategy.
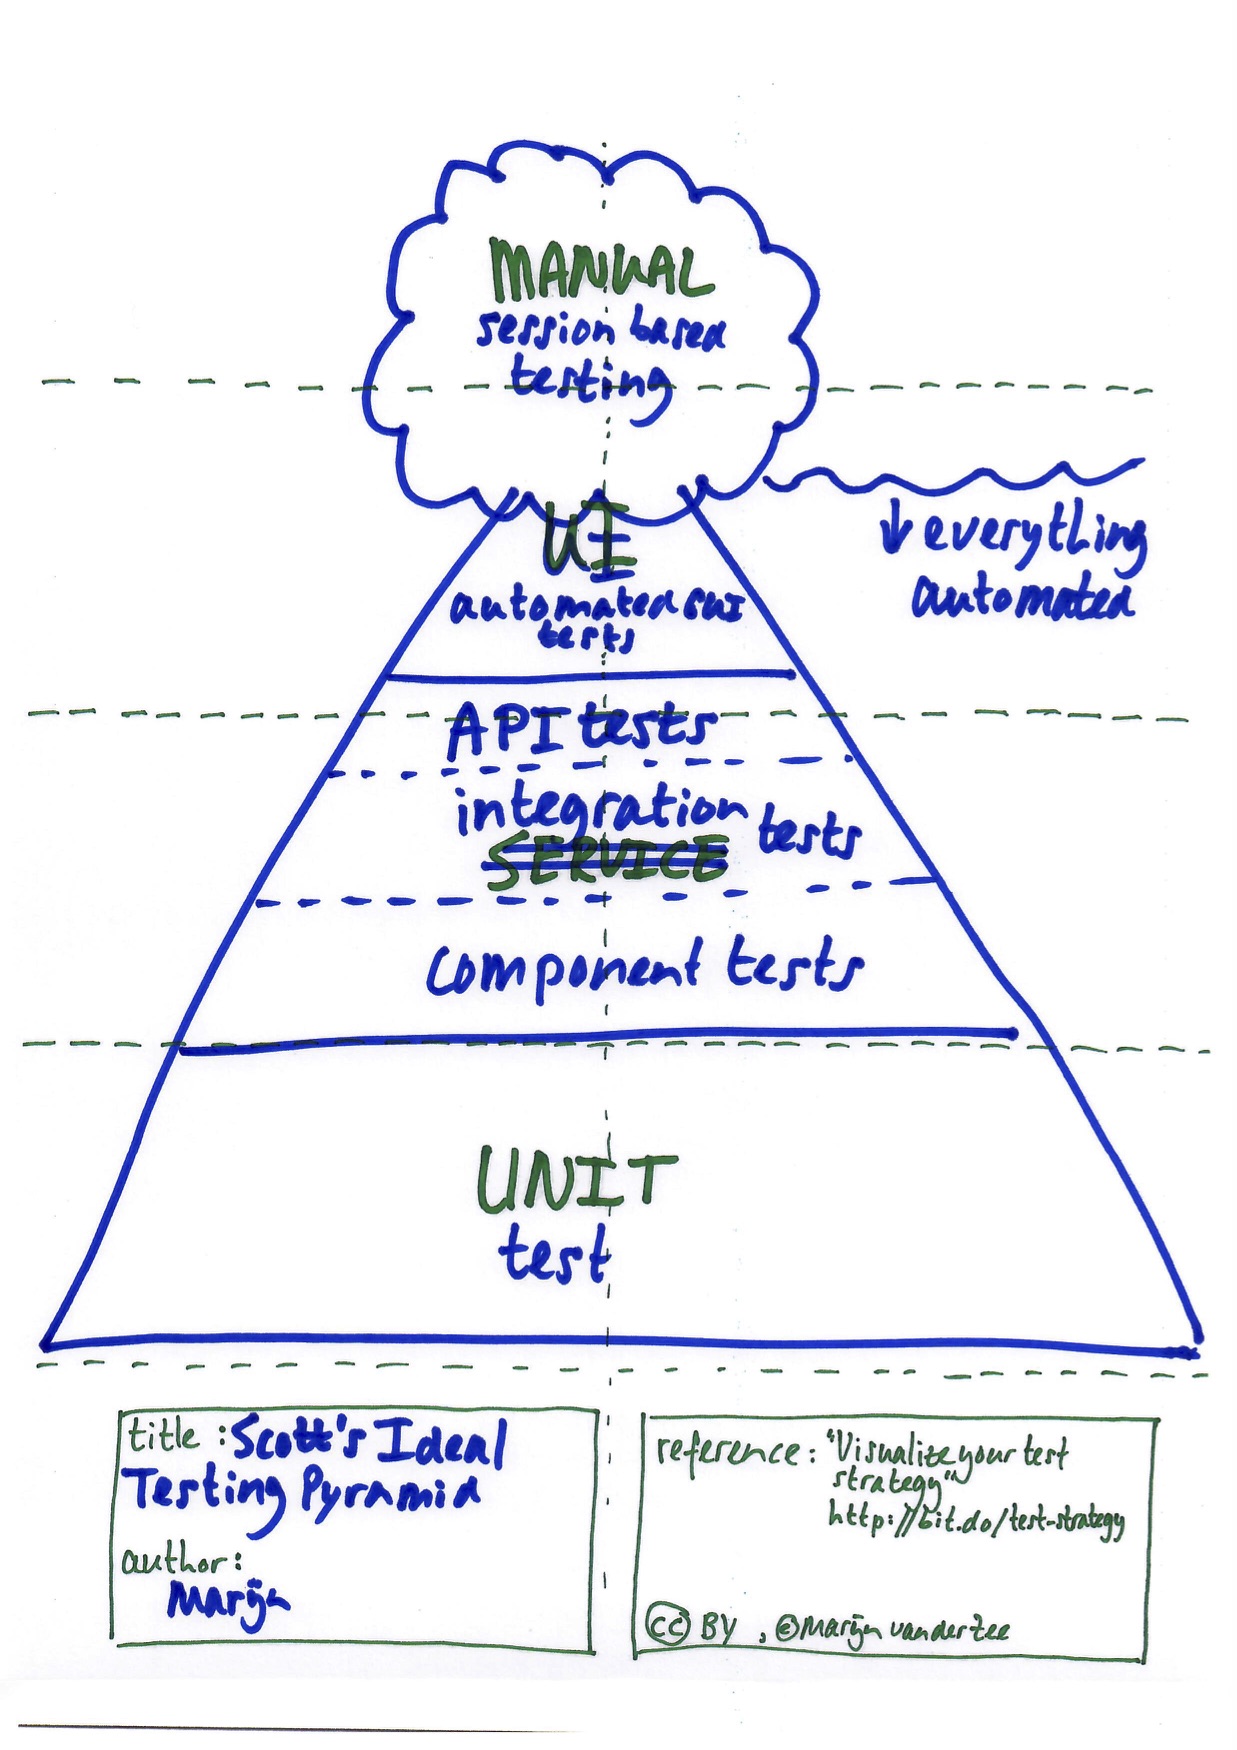
Since we (sadly) do not live in ideal world, chances are that your team does have some manual tests too. Let’s add all the manual (exploratory and prescribed) tests as a misty cloud hanging over the top of the pyramid. Then we arrive at Alister Scott’s software testing pyramid:
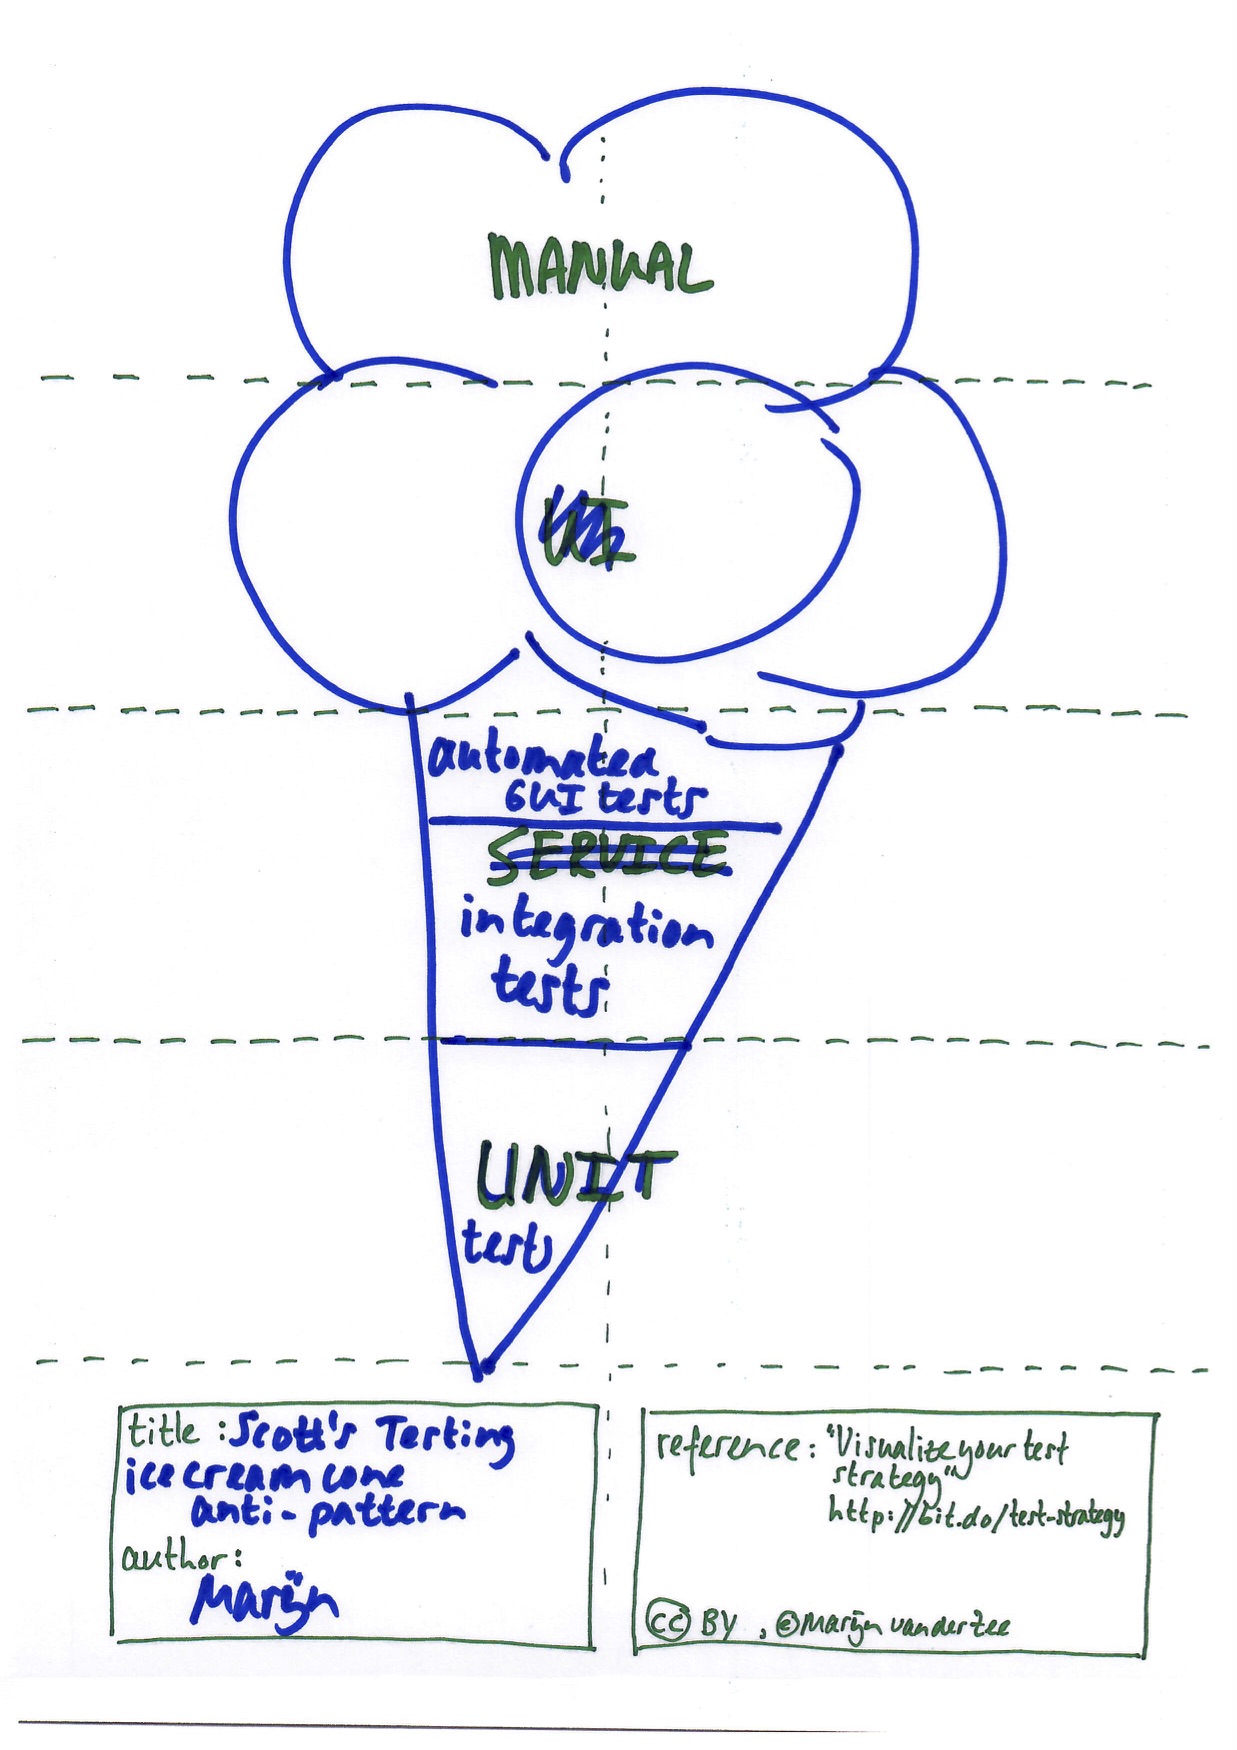
Alister Scott distinguishes an important testing anti-pattern, the ice cream cone anti pattern:
If you want to know more about the test automation pyramid (including a comprehensive example) then you should explore Ham Vocke’s article on Fowler’s bliki.
Exercise: visualize your team’s testing strategy
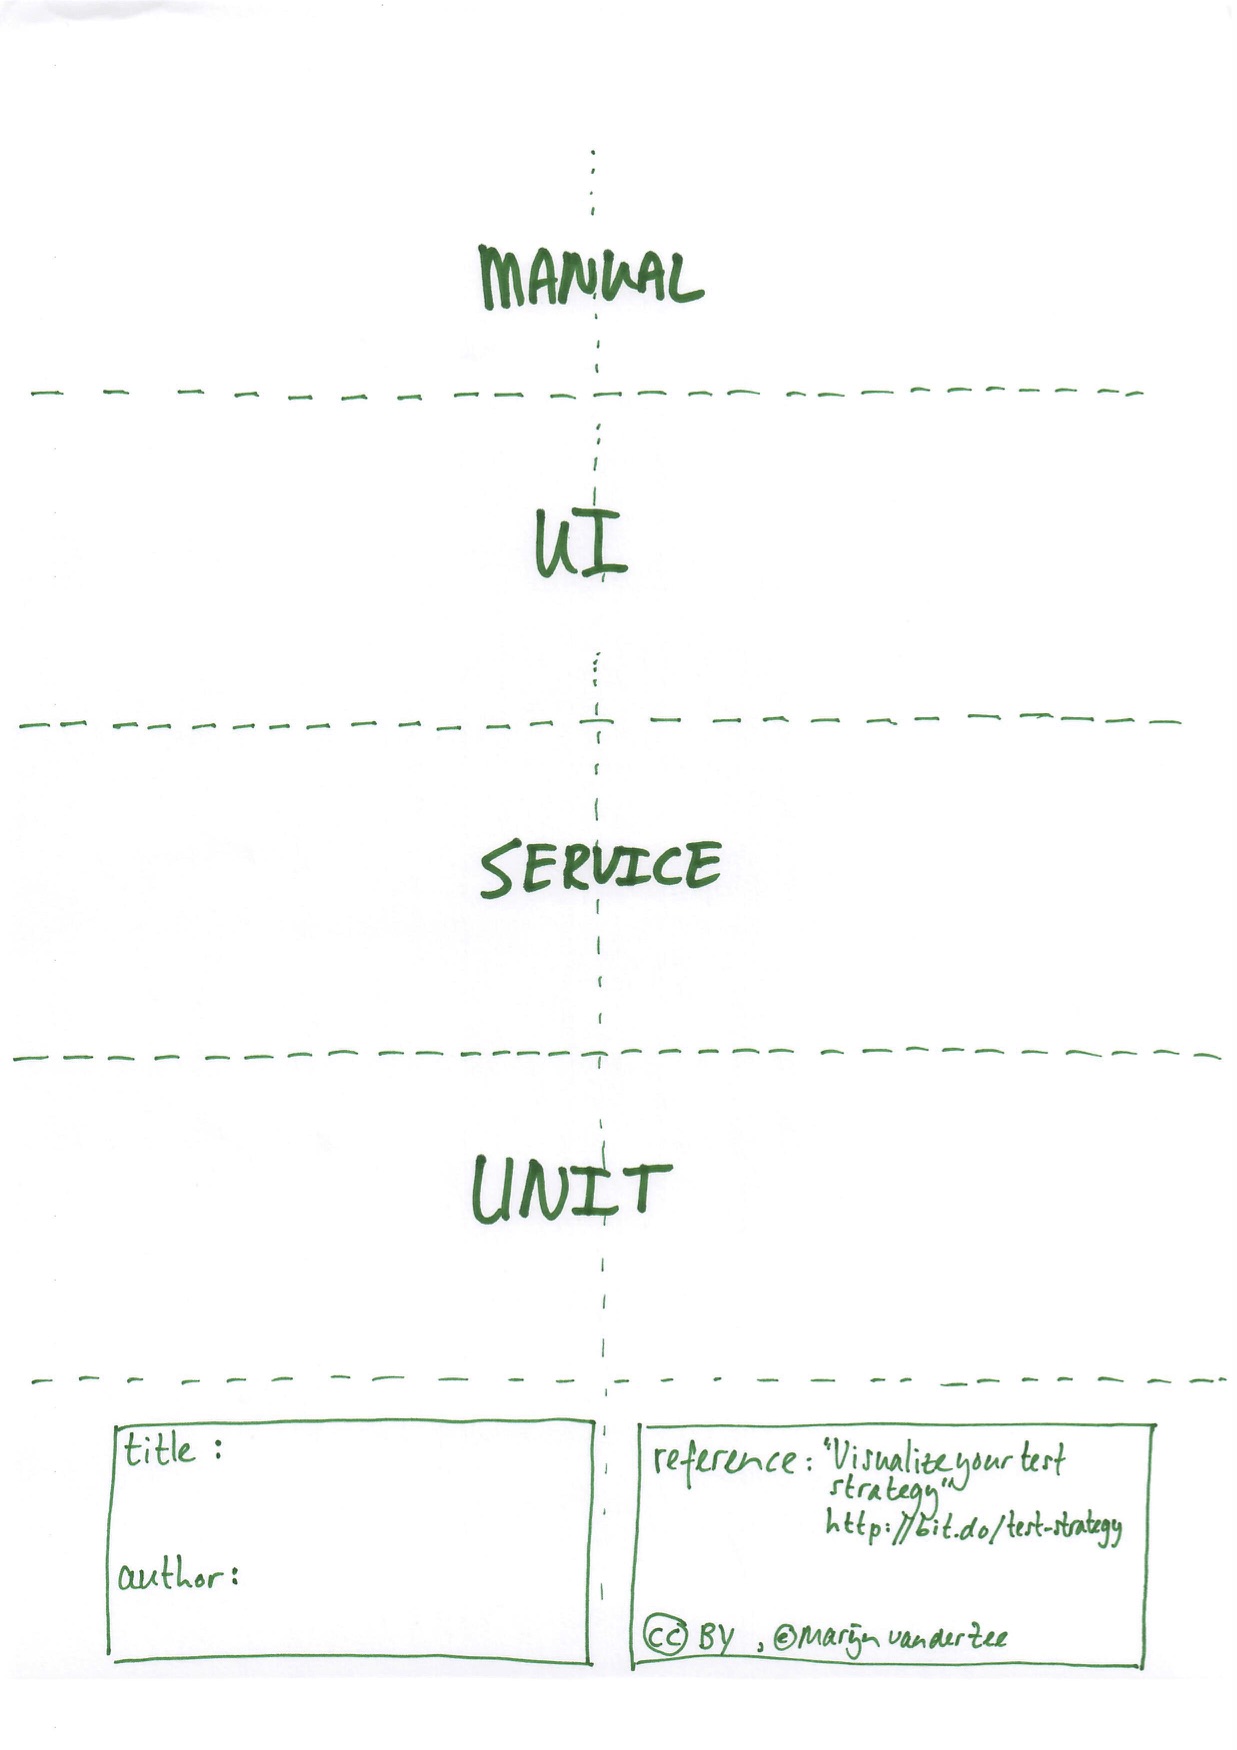
Now that you’ve seen four examples of test strategy visualizations, you can use this template to help your team visualize your team’s current and/or desired test strategy.
I suggest you present Scott’s software testing pyramid to the team, say in about five minutes, and discuss it for another five minutes to create a shared understanding. What does the width of a slice imply? Or its area?
Then hand out the empty templates to your team and ask them to visualize and name their current (or desired) test strategy. Let each member present her vision and discuss.
Can your team come up with a consensus on the current or desired state? Can your team draw a single visualization the whole team can agree on?
Have fun!

Comments
Leave a comment